Profiling Jolt
Execution profiling
Jolt is instrumented using tokio-rs/tracing for execution profiling.
We use the tracing_chrome crate to output traces in the format expected by Perfetto.
To generate a trace, run e.g.
cargo run --release -p jolt-core profile --name sha3 --format chrome
Where --name can be sha2, sha3, sha2-chain, fibonacci, or btreemap. The corresponding guest programs can be found in the examples directory. The benchmark inputs are provided in bench.rs.
The above command will output a JSON file in the workspace rootwith a name trace-<timestamp>.json, which can be viewed in Perfetto:
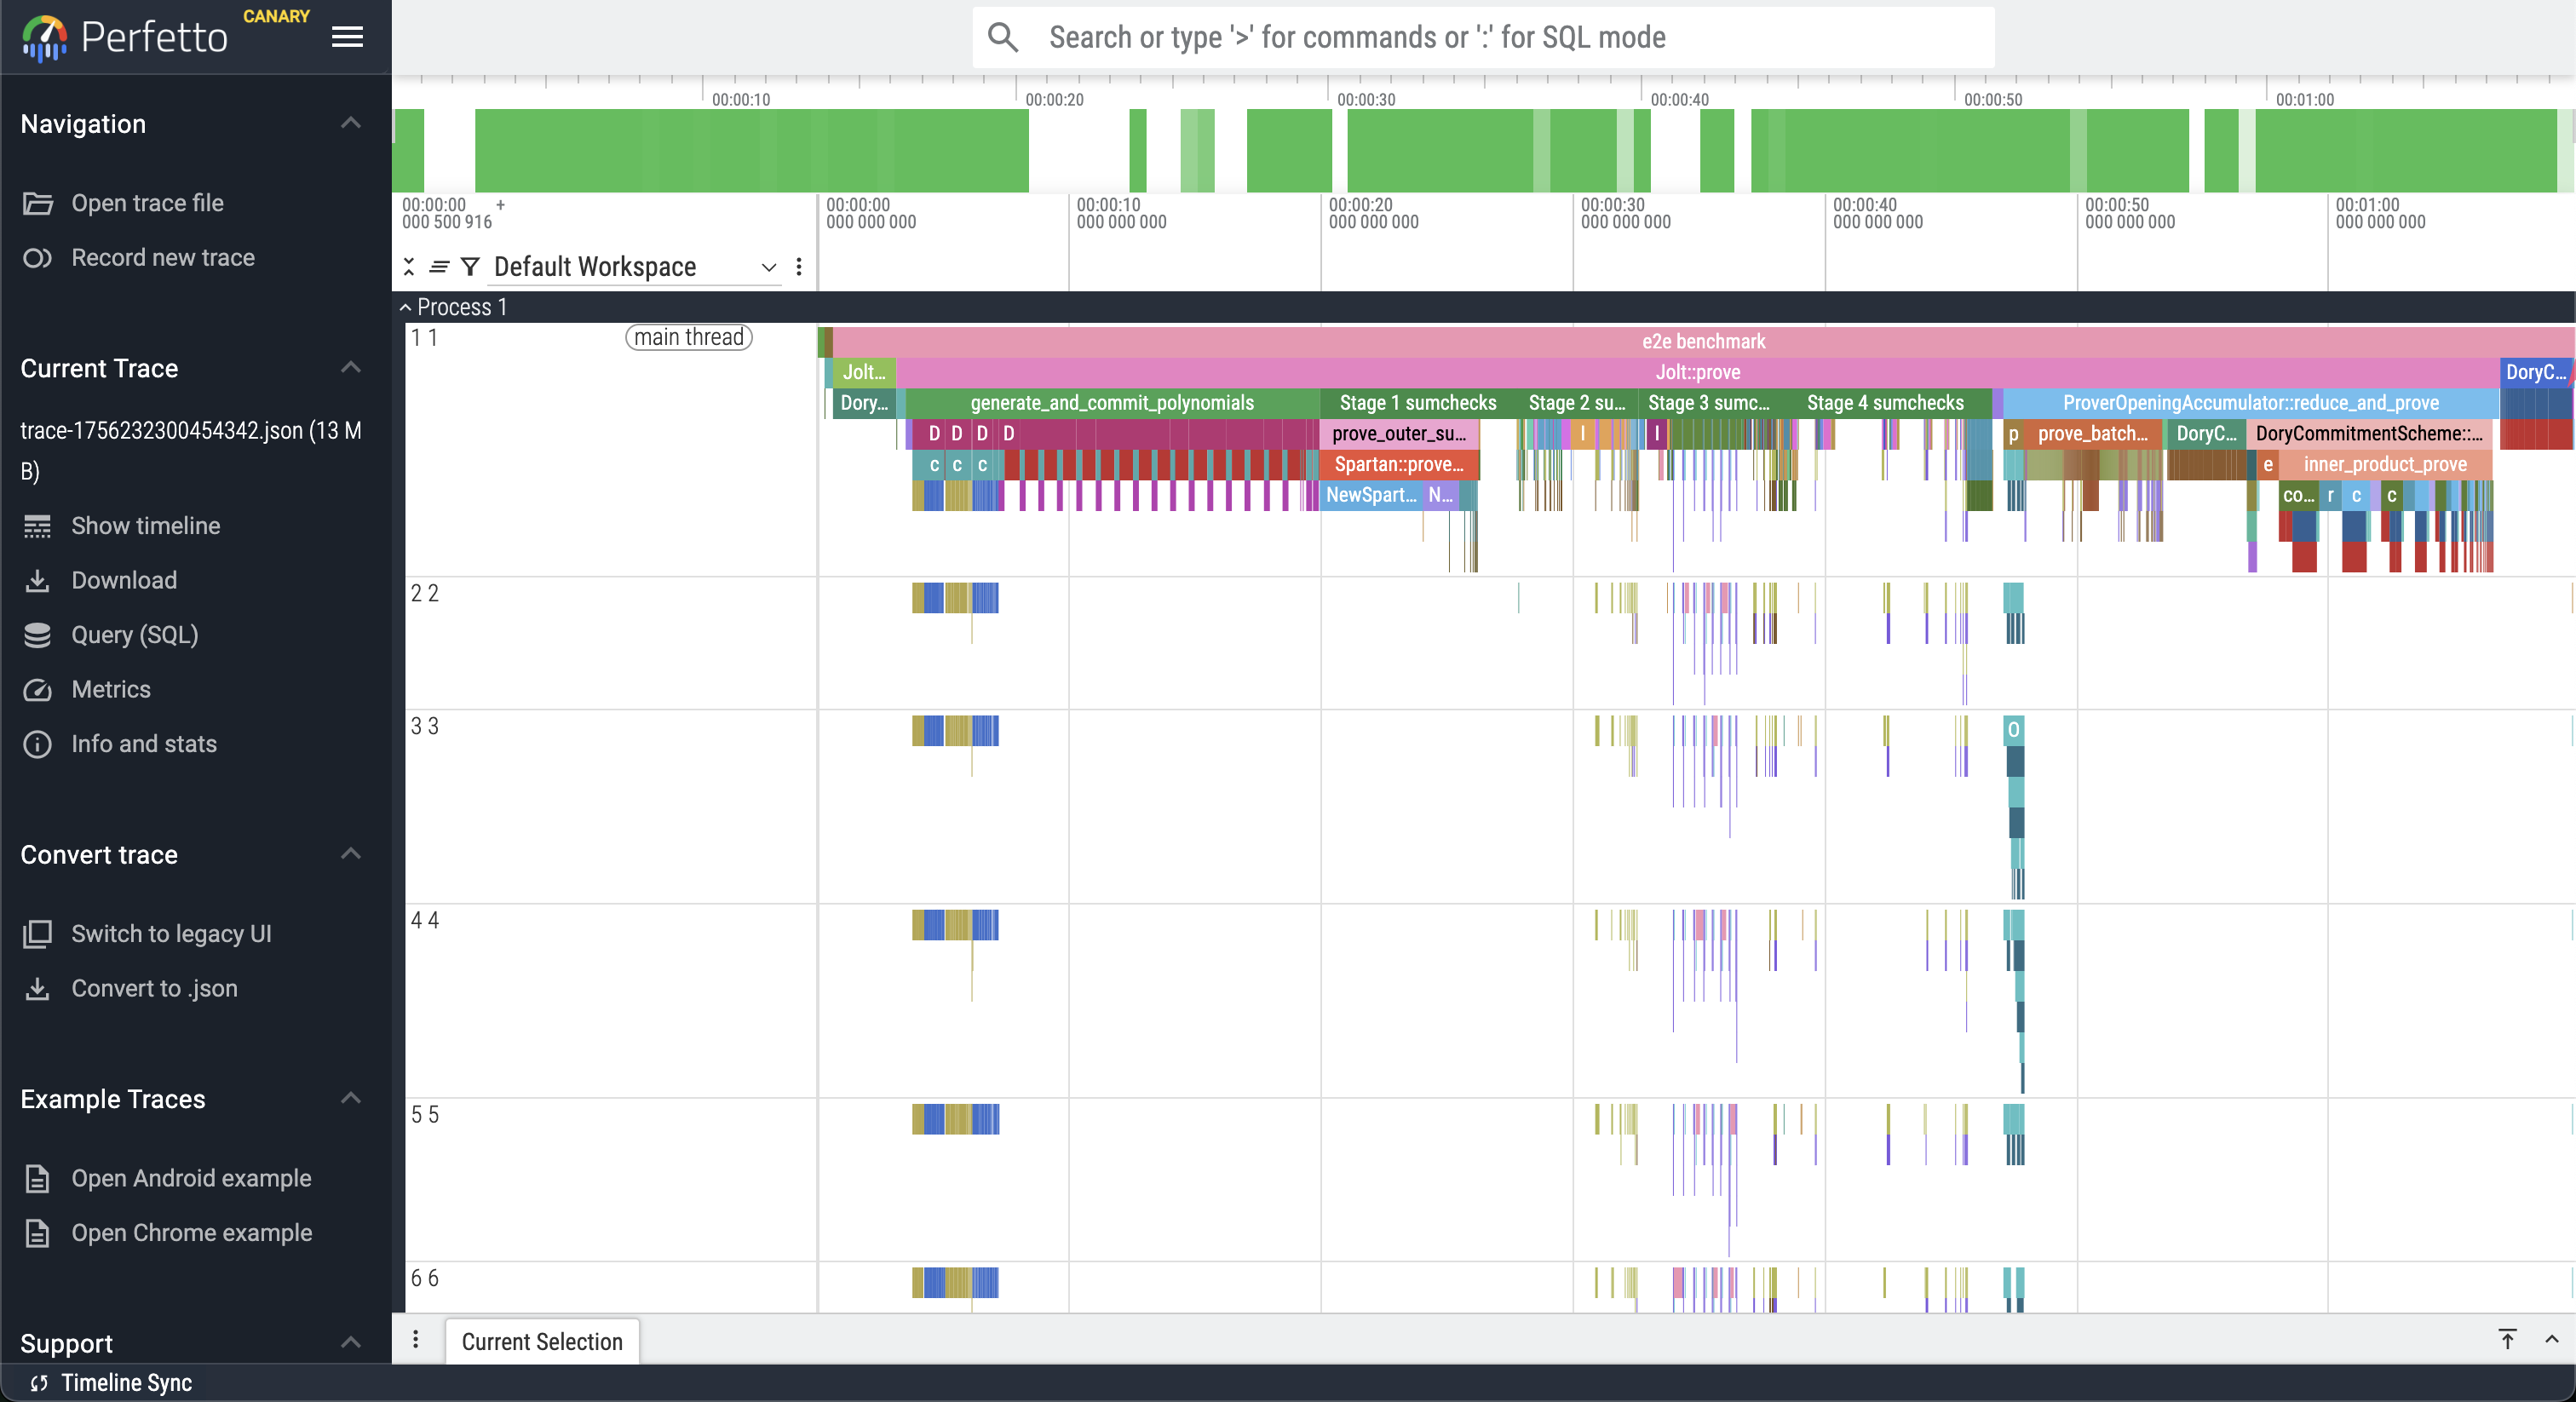
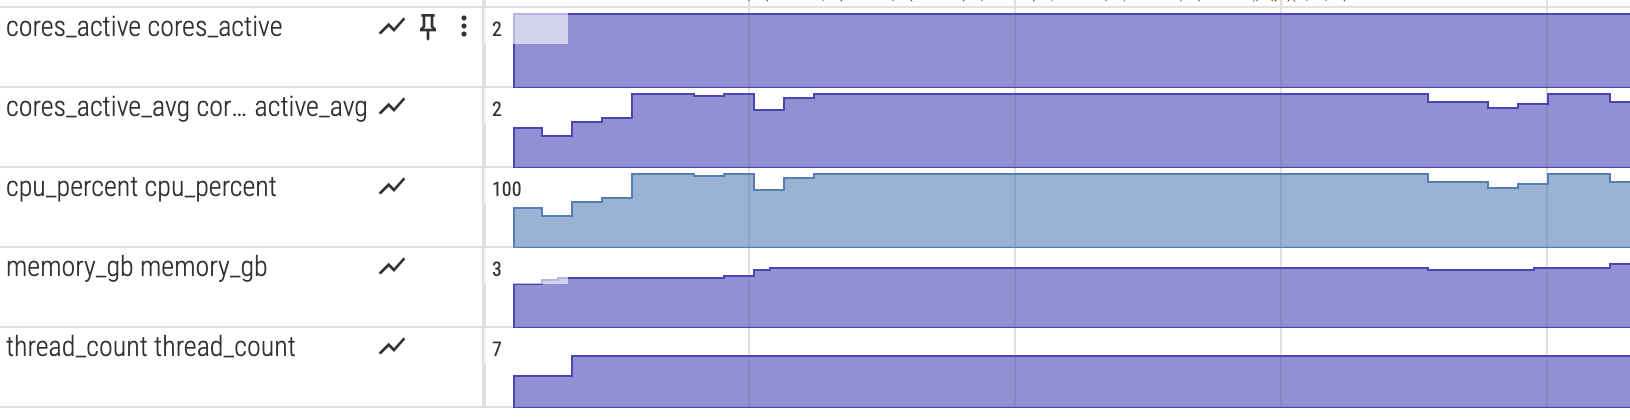
System resource monitoring
To visualize CPU and memory usage alongside the execution trace, enable the monitor feature:
cargo run --release --features monitor -p jolt-core profile --name sha3 --format chrome
python3 scripts/postprocess_trace.py trace-*.json
The postprocessing step converts the metrics into counter tracks for Perfetto.
Fine-grained CPU profiling with pprof
When tracing is insufficiently detailed, you can enable pprof for fine-grained CPU profiling. While execution tracing shows you the high-level stages and their durations (based on manually instrumented code), pprof automatically samples your entire program at the function level to capture each function call including in dependencies. This can help reveal performance bottlenecks that tracing might miss, such as unexpected hotspots in serialization, memory allocation, or cryptographic operations.
To enable pprof profiling, add the --features pprof flag:
cargo run --release --features pprof -p jolt-core profile --name sha3 --format chrome
This will generate multiple .pb profile files in benchmark-runs/pprof/, one for each major stage.
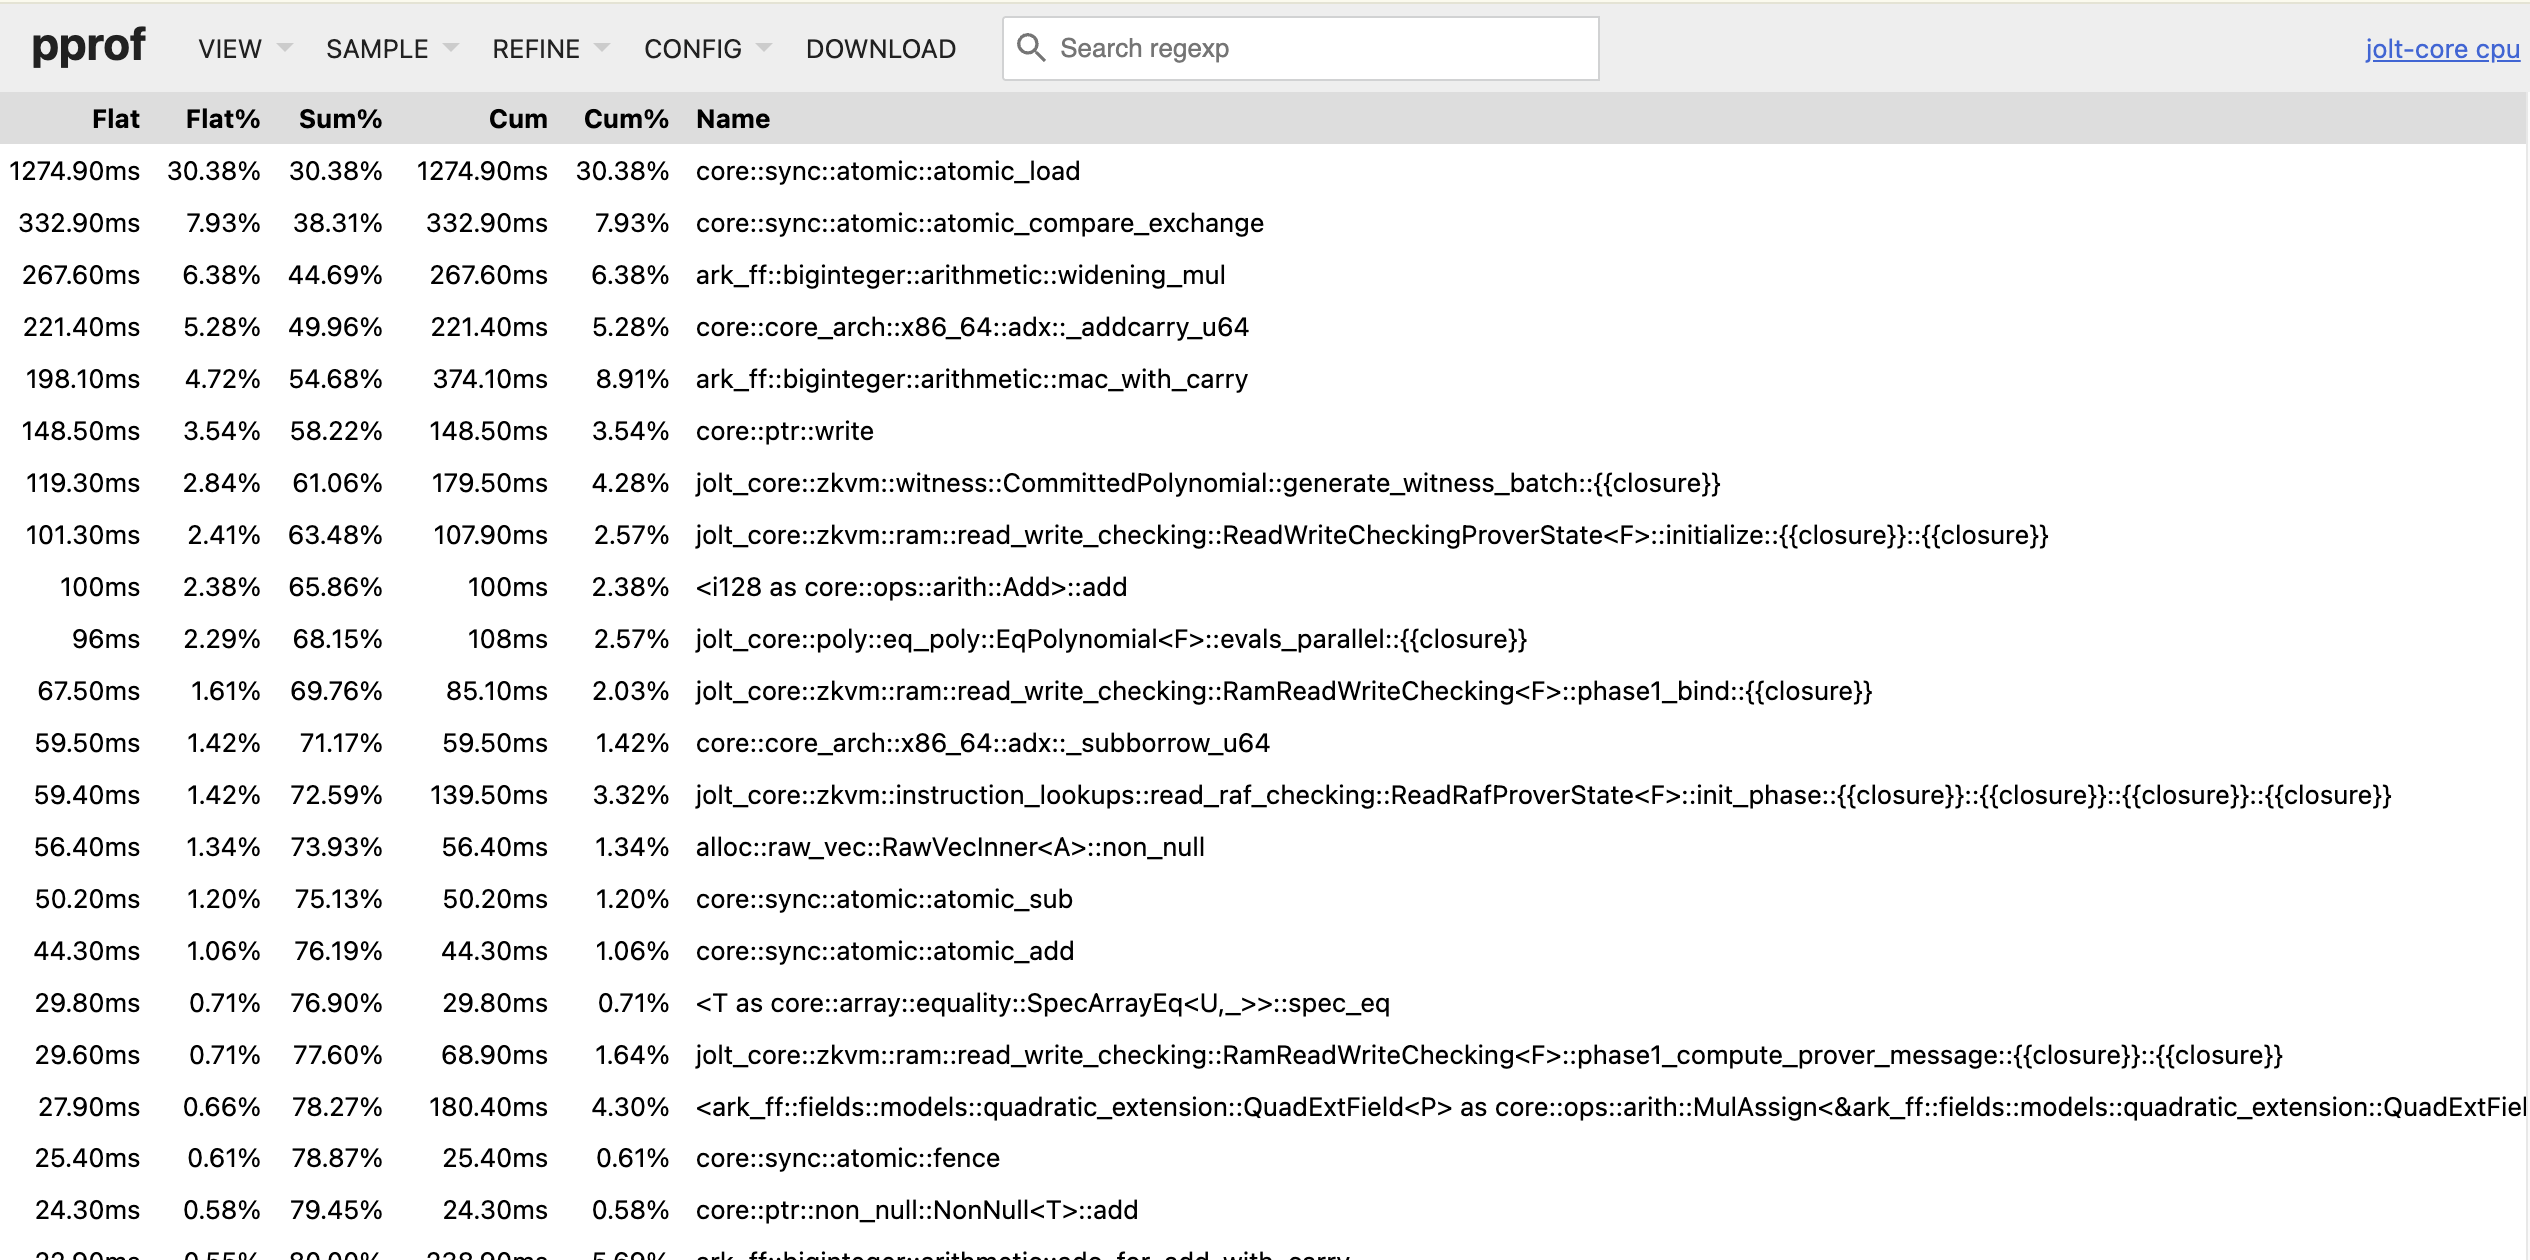
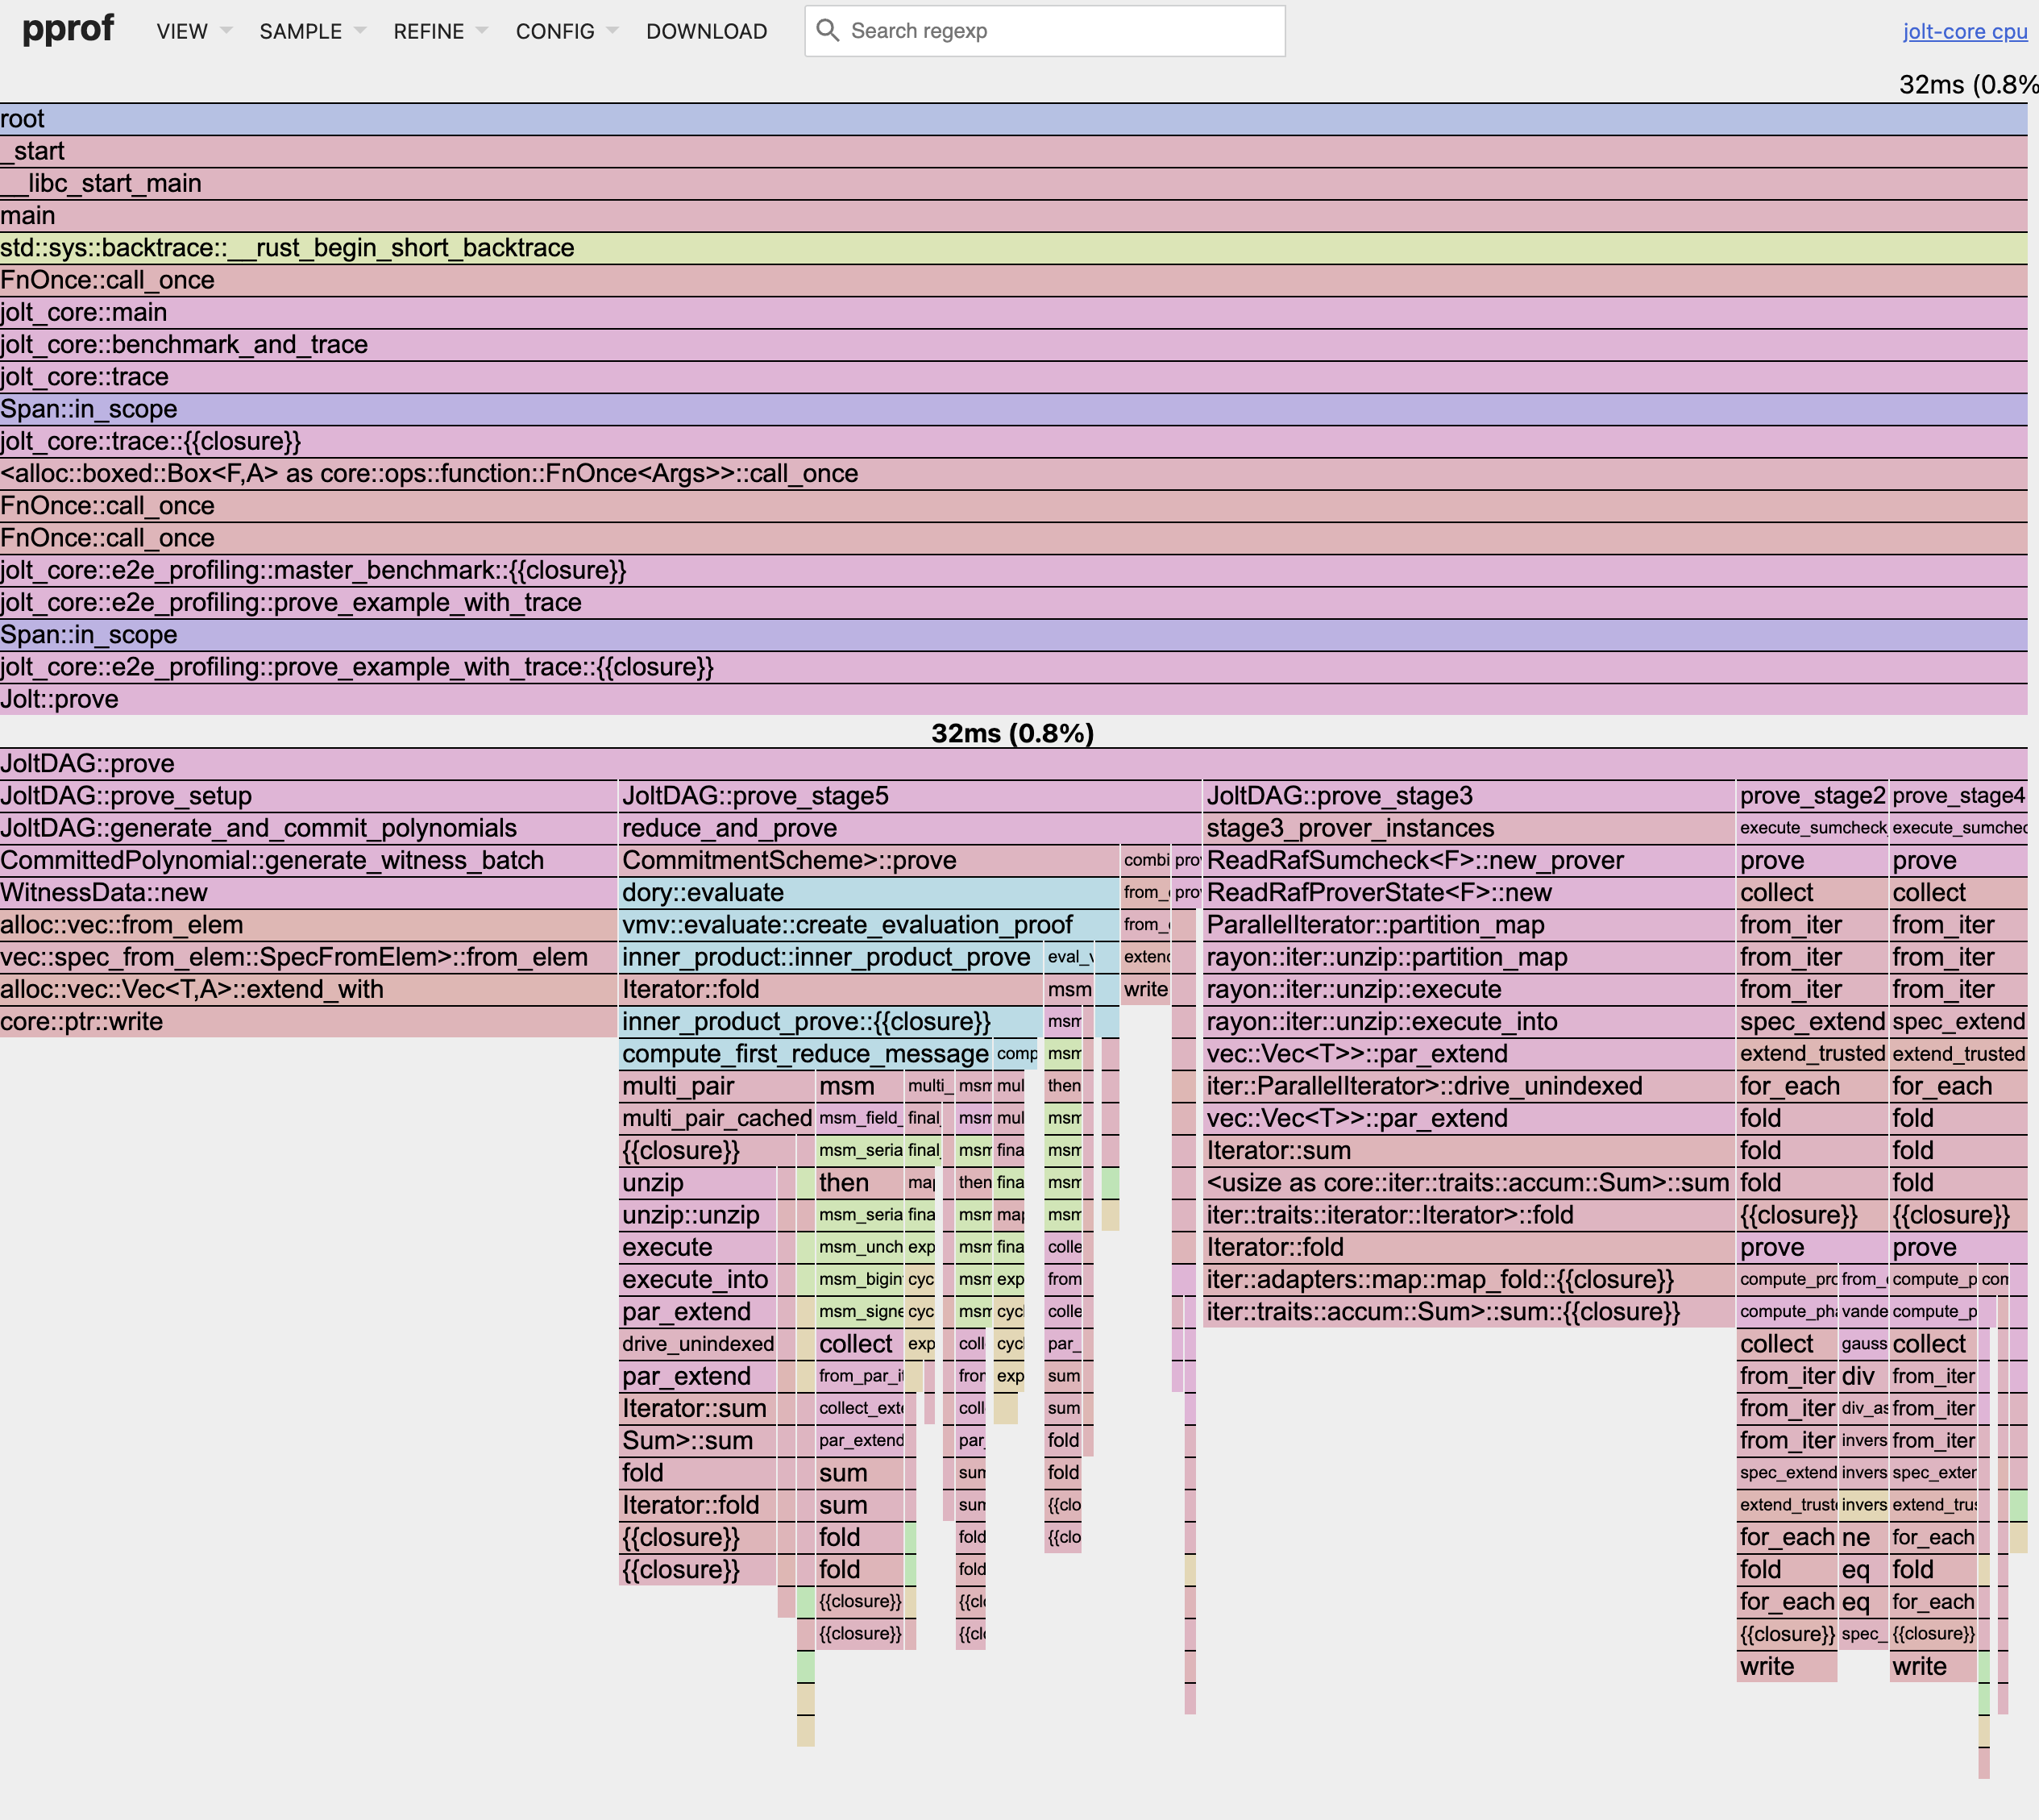
To view the proving profile in your browser using pprof, run:
go tool pprof -http=:8080 target/release/jolt-core benchmark-runs/pprof/sha3_prove.pb
This will start a web server at http://localhost:8080 where you can explore:
- Flame graphs - Visual representation of call stacks and time spent
- Top functions - List of functions consuming the most CPU time
- Source view - Line-by-line breakdown of CPU usage
- Call graph - Function call relationships
You may need to increase the sampling frequency to get a more detailed profile for shorter traces or decrease it for longer tracesto reduce overhead.You may customize the sampling frequency using the PPROF_FREQ environment variable (default: 100 Hz):
PPROF_FREQ=1000 cargo run --release --features pprof -p jolt-core profile --name sha3 --format chrome
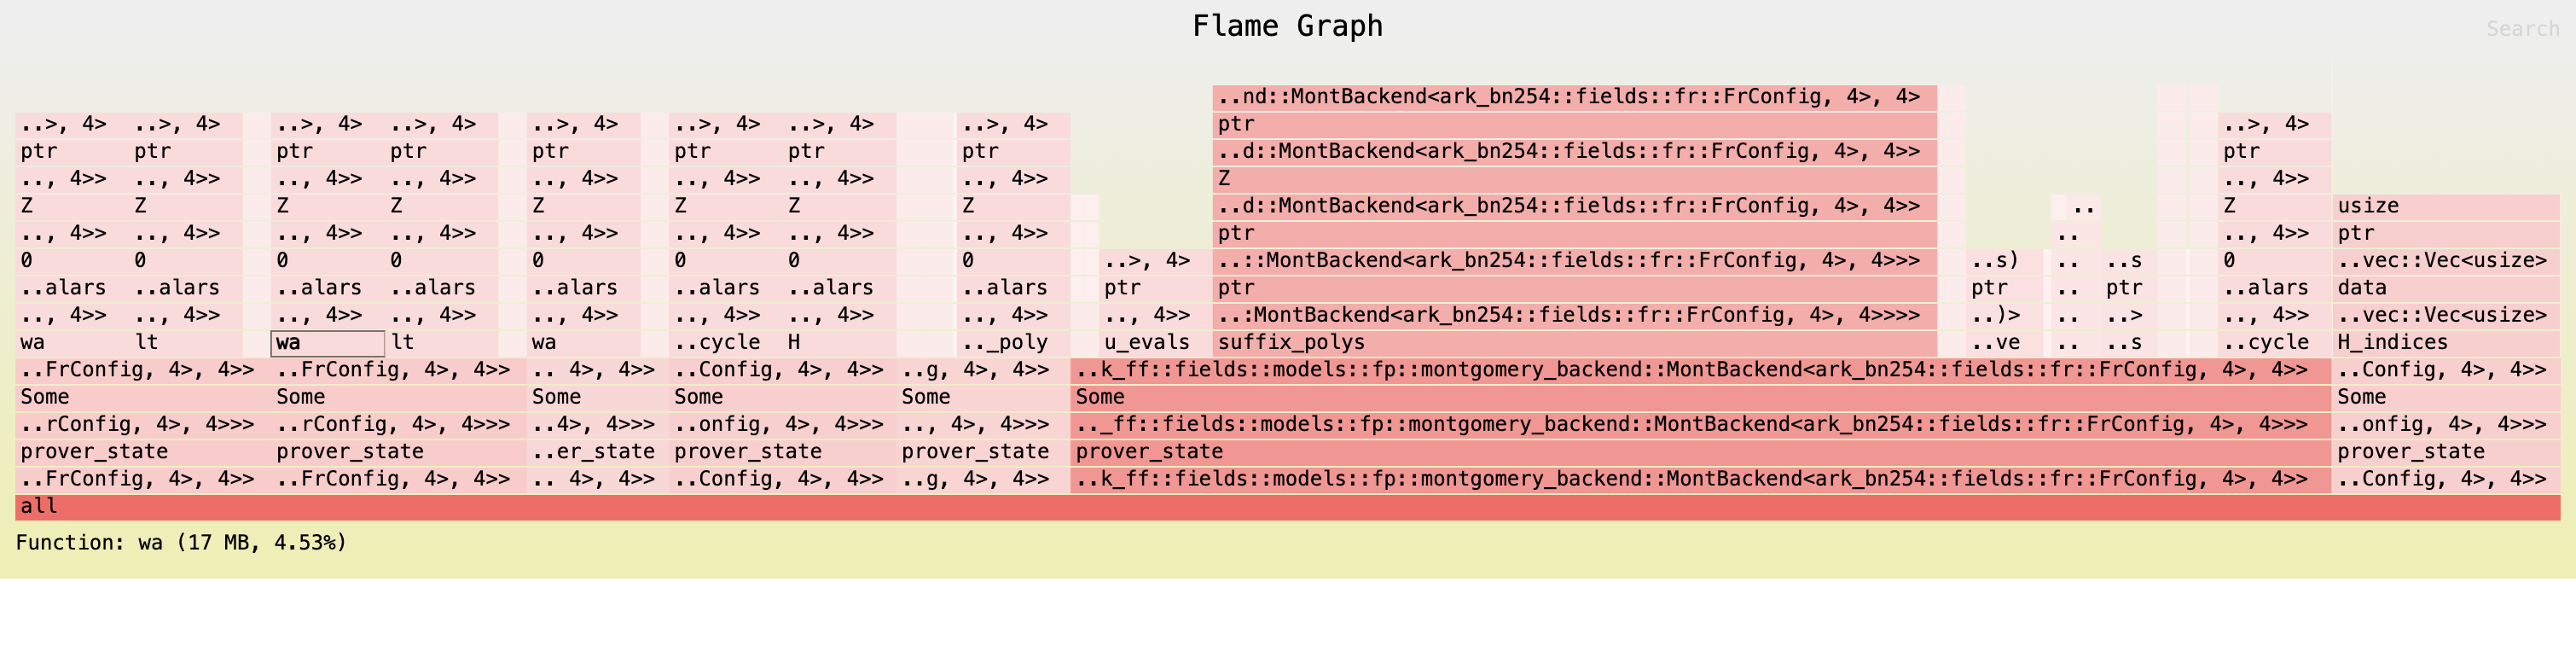
Memory profiling
Jolt uses allocative for memory profiling.
Allocative allows you to (recursively) measure the total heap space occupied by any data structure implementing the Allocative trait, and optionally generate a flamegraph.
In Jolt, most sumcheck data structures implement the Allocative trait, and we generate a flamegraph at the start and end of stages 2-7 of the Jolt DAG (see jolt_dag.rs).
To generate allocative output, run:
RUST_LOG=debug cargo run --release --features allocative -p jolt-core profile --name sha3 --format chrome
Where, as above, --name can be sha2, sha3, sha2-chain, fibonacci, or btreemap.
The above command will log memory usage info to the command line and output multiple SVG files, e.g. stage3_start_flamechart.svg, which can be viewed in a web browser of your choosing: